
Amplifying Project Impact
SEO and Analytics
Section outline
-
Welcome to Course 3! Now that you have built a thriving community and mastered your content strategy, it is time to scale your visibility and measure your actual success.
In the modern digital landscape, simply posting great content is often only half the battle. This module focuses on applied solutions for the real sector: how to smartly leverage digital advertising to confidently bypass algorithms, use analytics to track what truly drives engagement, and translate your raw data into transparent, compelling impact reports. We are leaving "vanity metrics" behind to focus on tools that deliver real-world results.
-
Before we dive into the exact mechanics of targeted ads and data analysis, let’s test your current intuition about the digital landscape. Take a moment to answer this quick True/False quiz!
-
-
Lesson 1: Digital Ads & Organic Reach
-
Students mustMark as done
Search Engine Optimization (SEO) – The Organic Foundation
Before spending money on ads, you must build a system that attracts people naturally. While the SINFT project champions Web3 and decentralization, billions of people still use Web2 search engines (Google) or privacy-focused alternatives (Brave, DuckDuckGo) to find information.
SEO (Search Engine Optimization) is the practice of structuring your content so that it ranks at the top of these search results for free.
The 3 Pillars of Social Impact SEO:
1.Keyword Intent: Don't just target broad words like "charity" or "NFT." Target specific phrases your ideal supporters are actually searching for.
- Example: Instead of trying to rank for "clean water," optimize your pages for "how to donate crypto for clean water projects."
2. On-Page Optimization: Ensure search engines can easily read your site.
- Include your primary keyword in your Page Title (H1), subheadings (H2), and the URL slug.
- Write highly readable, structured content. Search engines prioritize sites that offer clear, immediate value to the user.
3. E-E-A-T (Experience, Expertise, Authoritativeness, Trustworthiness): Search engines heavily favor trustworthy sources, especially for financial or charitable topics. Build authority by earning backlinks (links pointing to your site) from established NGOs, Web3 grant platforms, and news outlets.
-
Students mustMark as done
Digital Ads – Renting Web2 Attention
While SEO builds long-term value, it takes time. Digital Ads buy you immediate, guaranteed visibility.
Organic reach has plummeted across major platforms like Facebook and Instagram. Algorithms prioritize keeping users on the app, often showing them massive creators rather than local NGOs. If you have 1,000 followers, a regular post might reach only 50 of them.
Web3 Philosophy Note: As a decentralized project, our ultimate goal is to build communities on open-source, Web3 platforms. However, to scale our impact, we must temporarily use Web2 monopolies (e.g., Meta and Google) as megaphones. We rent their attention to bring mainstream users into our decentralized ecosystem.
The Main Types of Digital Advertising (With Real-World Cases):
Not all ads work the same way. Depending on your goal, you will choose different tools from the broader digital advertising ecosystem:
Targeted Social Media Ads (e.g., Meta/Facebook, Instagram, LinkedIn):
This is "Push" marketing. You define an audience based on their interests, age, or location, and the platform pushes your message into their social feeds while they are scrolling.Real-World Case: UNICEF Emergency Appeals. During global crises, UNICEF uses hyper-targeted Meta ads directed at people who have previously engaged with humanitarian pages. They push urgent, emotional posts directly into Instagram feeds to generate immediate donations.
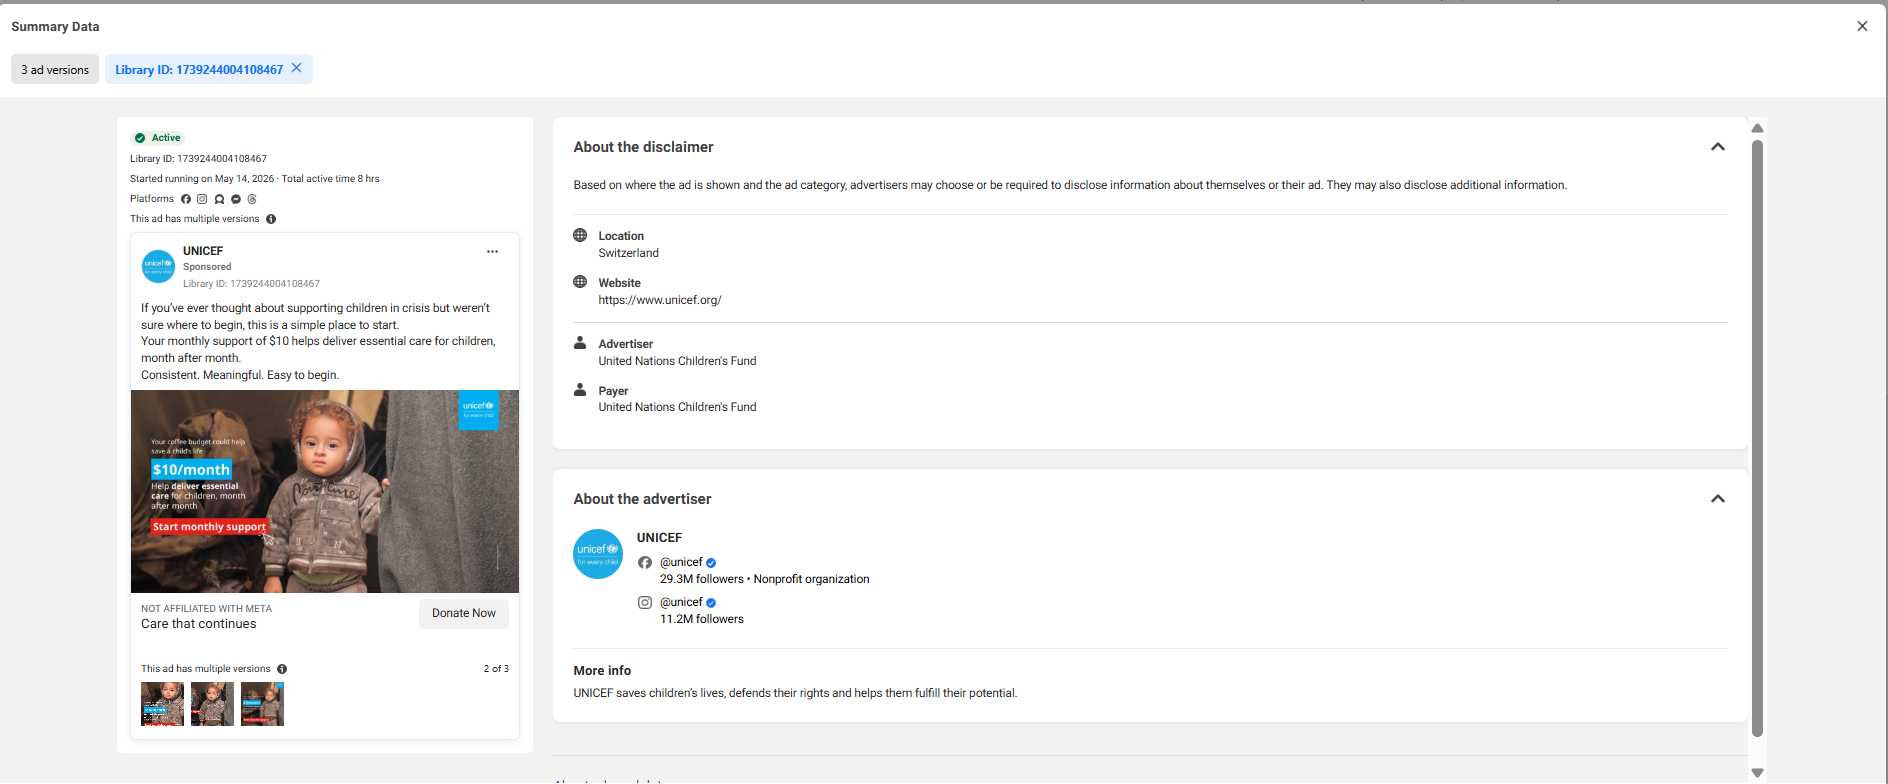
Pro Tip: You can study active charity ads transparently via the Meta Ad Library to find inspiration!
Contextual & Search Ads (e.g., Google Search Ads):
This is "Pull" marketing. Your ad only appears when someone actively searches for a specific keyword (e.g., "how to support local youth NGOs"). You are answering a question they are already asking.Real-World Case: Save Ukraine. When a user types "how to help Ukraine from the UK" into Google, this initiative appears at the very top of the search results as a Sponsored ad. They capture people with high intent who are already looking for a way to contribute.
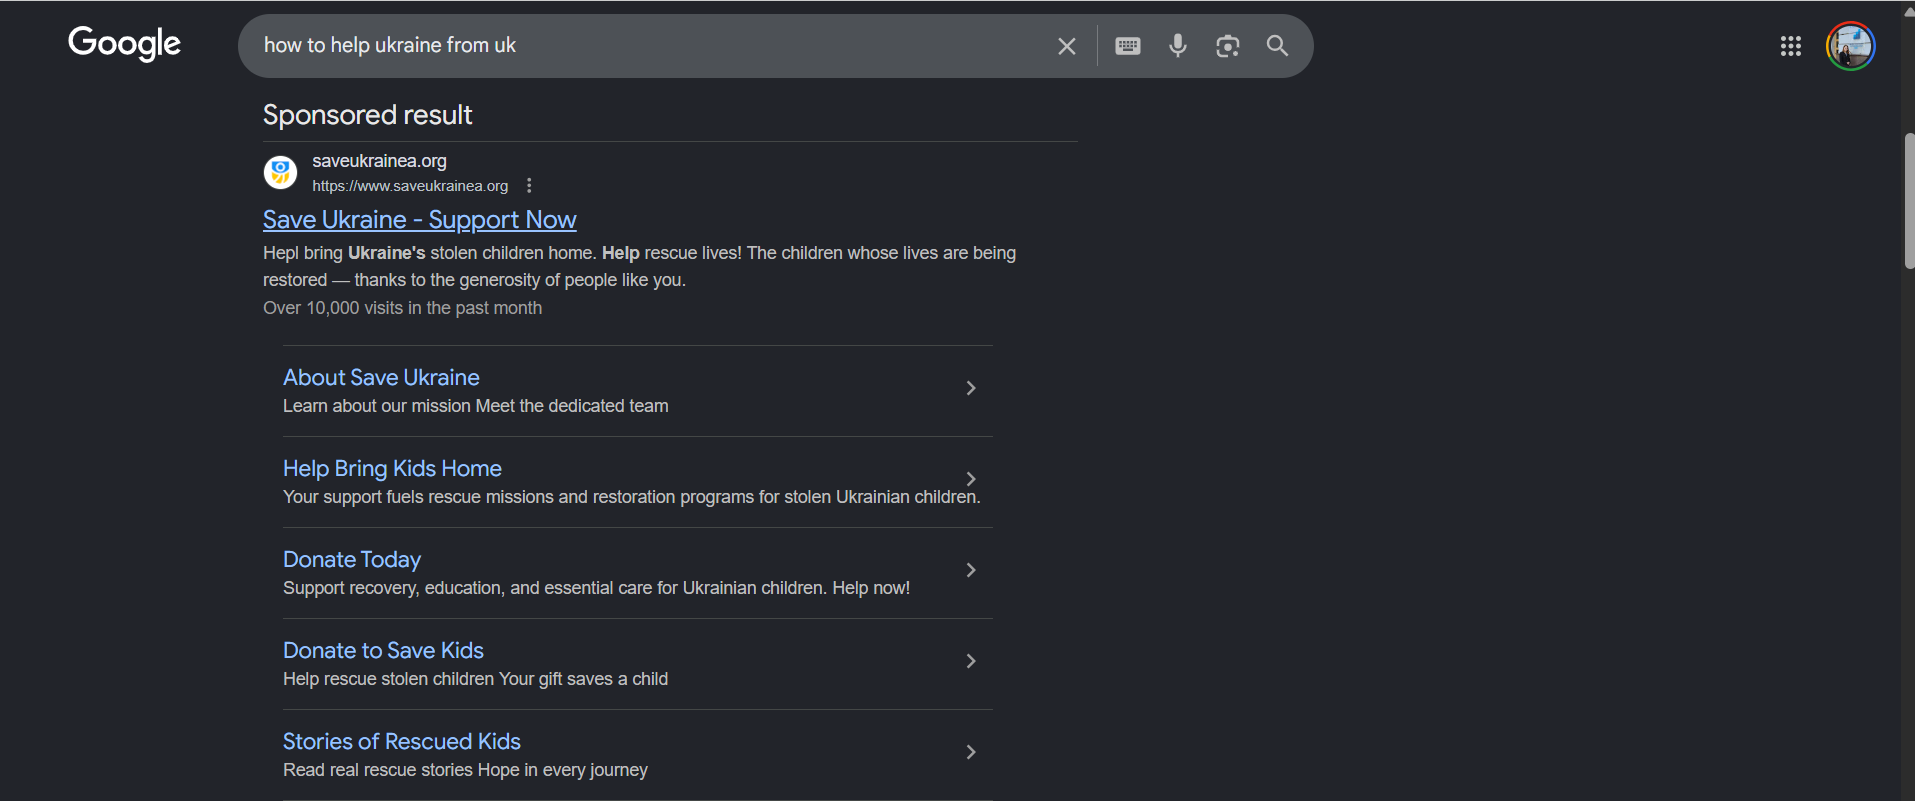
Pro Tip for NGOs: You can apply for Google Ad Grants, which provides up to $10,000 per month in free search ads for eligible non-profits!
Display & Banner Ads:
These are the visual banners you see on the side of news websites or blogs. They are excellent for "Retargeting" — reminding people who have already visited your website to come back and complete an action.Real-World Case: Save the Children. Imagine someone visits the Save the Children website, reads about child hunger, but leaves without donating. Using tools like the Google Display Network, the charity places a visual banner on a news website that user visits the next day. The banner acts as a gentle visual reminder (a "nudge") to return and complete their donation.

Native & Influencer Ads:
Paying a trusted community figure or a niche blogger to talk about your project naturally within their own content. In the Web3 and social impact space, an authentic endorsement from a trusted creator is often more powerful than a traditional banner ad.Real-World Case: #TeamTrees by MrBeast & Arbor Day Foundation. Instead of buying traditional corporate ads, this initiative partnered with hundreds of YouTube influencers. These creators made their own authentic, native videos about planting trees and asked their audiences to donate. Because the message came directly from creators the audience already trusted, the campaign went incredibly viral and raised over $24 million.
-
Students mustMark as done
How to Work with Digital Ads
You do not need a massive budget to run effective digital campaigns (you can start with €5 a day). You just need to understand the architecture. Platforms like Meta (Facebook/Instagram) structure ads in three levels: Campaign (The Goal) ➔ Ad Set (The Audience) ➔ Ad (The Visual/Text).
The Campaign Level: Setting Simple Goals
Before spending a single penny, the platform will ask you for your objective. What do we actually want people to do?
-
Awareness (The Megaphone): You want maximum eyeballs on a new initiative. The platform will show your ad to people most likely to look at it and remember it. Goal: Let people know you exist.
-
Traffic / Clicks (The Bridge): You want people to leave the social platform and visit your website, read a detailed impact report, or sign a petition. The platform shows the ad to people who have a history of clicking links.
-
Engagement (The Conversation): You want people to interact with the post—liking, sharing, commenting, or messaging your page to spark a public conversation.
The Ad Set Level: Budgeting and Targeting
The true superpower of digital ads is precision. You are not buying a billboard on a motorway hoping the right person drives past; you are delivering a message directly to people who already share your values.
Cold vs. Warm Audiences
- Cold Audiences (Interest-Based): These are people who don't know you yet. You target them by defining location, interests, and demographics.
- Warm Audiences (Custom Retargeting): This is where the magic happens. You can tell Meta to show your ad only to people who have already engaged with your Instagram page in the last 90 days, or people who watched 50% of your last video. They already trust you, making them 10x more likely to donate or sign up!
Setting Up Targeted Ads in Meta Business Suite
To run professional ads, never use the simple "Boost Post" button on your phone. It limits your targeting and wastes your budget. Instead, use the Meta Business Suite (Ads Manager), which gives you full control.
Stepping into the Meta Business Suite for the first time can feel overwhelming – there are dozens of buttons, graphs, and settings. But do not worry! You only need to understand a few core features to launch a successful campaign. In the video tutorial below, we will demystify this dashboard.
Quick Setup Checklist:
- Goal: Choose your objective (e.g., "Get more website visitors").
- Schedule & Budget: Set duration and a small daily budget (e.g., €5.00).
- Audience: Define location, age, and interests in the Detailed Targeting box.
- Creative: Upload authentic photos/videos, paste your impact-focused story, and choose a Call to Action button.
- Publish: Review the mobile preview and click "Promote Now."
-
-
Students mustMark as done
Balancing Organic Growth and Paid Strategies
Before we look at the comparison, let's clearly define our terms:
🌱 Organic Promotion is the digital equivalent of word-of-mouth. It involves posting content on your feed, engaging in comments, and naturally growing your audience without spending money on distribution. It relies on the platform's algorithm and community sharing. It builds deep, authentic trust but takes significant time.
📢 Paid Promotion, on the other hand, is the digital equivalent of buying a targeted megaphone. You pay the platform to guarantee your message is placed directly in front of a specific, defined audience, bypassing the natural algorithm for immediate visibility.
A healthy digital strategy requires a balance of both paid and organic efforts. They are not competitors; they are partners. Relying solely on organic growth might mean your project starves for attention in the beginning, while relying only on paid ads can make your project feel like a soulless corporation. Let's see how their strengths and weaknesses compare.
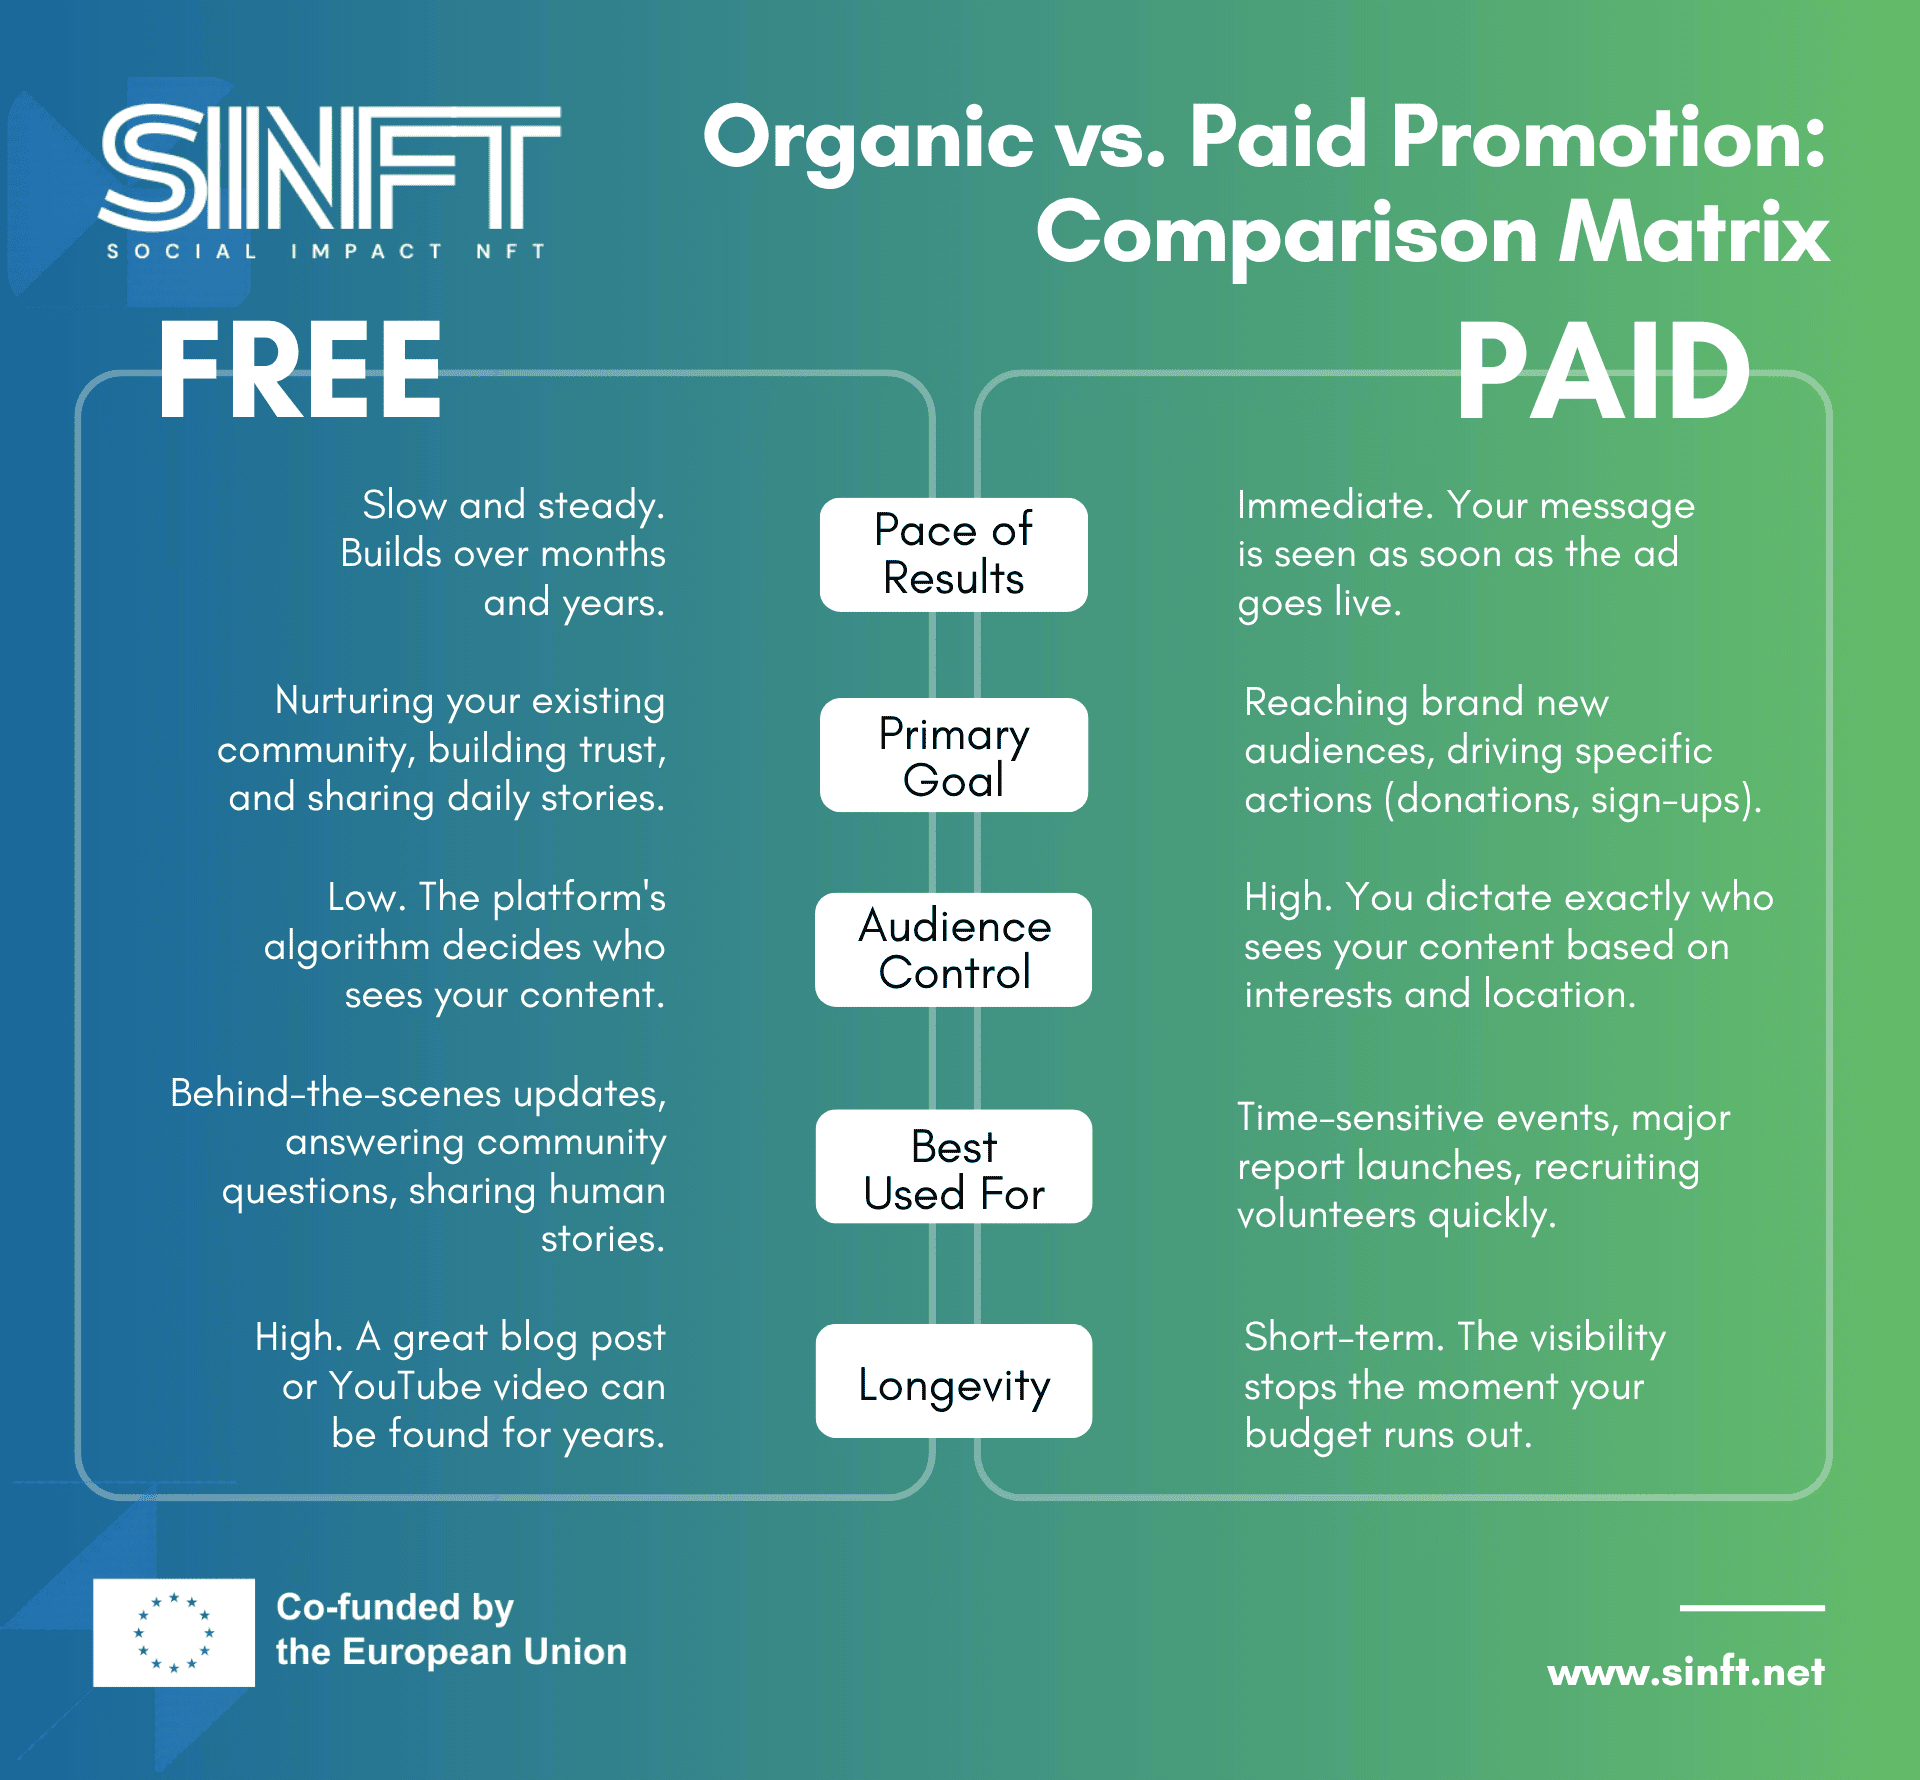
How to combine them? Do not guess what will make a good ad. Use your organic content as a testing ground. Post 4 or 5 different stories organically for free. See which one naturally gets the most likes, comments, and shares from your core community. Take that specific winning post and turn it into a Paid Ad. If your current community loved it, the algorithm will easily find new people who will love it too.
-
Students mustMark as done
Impact-Focused Messaging
How do you promote a social cause without sounding like a
pushy salesperson?Shift your focus from selling to storytelling. In Web3, avoid aggressive "shilling" ("Mint now!", "To the moon!"). Frame the call to action around the tangible result. Blend digital art with real-world visuals, and ditch the heavy crypto jargon.Use these frameworks for ad copywriting:
The AIDMA Model (For short ads):
- Attention: Hook them immediately.
- Interest: Explain why it matters now.
- Desire: Show the benefit.
- Memory: Make it stick.
- Action: Tell them what to do.
Example (Ocean Cleanup Initiative):
(A) Did you know 70% of city plastic ends up in our local river? (I) Our volunteer teams have been tracking this pollution for a year, and the levels are rising fast. (D) Imagine a river where our kids can safely swim again, free of toxic waste. (M) Last month, we removed 2 tons of plastic — but we need more hands. (A) Click the link below to join our next Sunday cleanup!The DIBABA Model
-
Define the specific community need or problem.
-
Identify with the audience's shared values and emotions regarding this issue.
-
Build trust by showing how your project effectively addresses the need.
-
Acceptance: Share a brief testimonial or data point to prove your work is real.
-
Buy-in: Create a desire to be part of the solution.
-
Action: Provide a clear, low-friction next step.
Example (Youth Digital Hub):
(Define) Right now, over 40% of youth in our region lack access to laptops and digital skills. (Identify) Like you, we believe that talent is everywhere, but opportunity is not. No young person should be left behind in the digital age. (Build) That’s why we launched the 'TechBridge Hub', providing free coding classes and computer access after school. (Acceptance) Since January, 150 students have already built their first websites, and 10 have secured paid internships. (Buy-in) You have the power to help us keep these doors open and launch the next generation of digital leaders. (Action) A €10 donation sponsors one student's internet access for a month. Tap 'Donate' to make a real impact today.Launch a Movement, Not Just an Ad
The digital landscape is incredibly noisy, but authentic social impact always cuts through. Your goal is no longer to just "post and hope" — it is to take proactive control of your visibility.
Remember that behind every data point, algorithm, and targeting metric is a real human being looking to be part of something meaningful. Whether you are relying on the steady, trust-building growth of organic content or the immediate megaphone of paid advertising, your core mission remains the same: transforming passive scrollers into passionate advocates.
Do not be afraid to invest in your visibility. Use these communication frameworks to speak from the heart, step out of the traditional corporate monologue, and start putting your project directly in front of the people who are already waiting to support your cause.
-
Ready to test your knowledge?
Take this quick 5-question quiz to review the key concepts covered in this lesson. This brief knowledge check will help you reinforce what you've learned and ensure you're ready to apply these new strategies to your own project.
-
-
-
Lesson 2: Analytics Made Easy
-
Students mustMark as done
Why is Tracking Metrics Essential?
Creating content without looking at analytics is like driving a car blindfolded. Tracking metrics is essential for three reasons:
- Efficiency: It saves you time and money. If short 15-second TikTok videos bring you 10x more volunteers than long articles, data tells you to stop writing articles.
- Proving Impact: Donors and Web3 grant programs want proof. Saying "Our educational campaign reached 50,000 youths and drove 1,200 website clicks" gets you funded. Data is the language of trust.
- Audience Alignment: Data tells you who is actually watching. It helps you pivot your message to match the people who actually care.
Vanity Metrics vs. Actionable Metrics
Before we look at dashboards, we must address the biggest trap in digital marketing:
Vanity Metrics
are numbers that look great on paper and boost your ego (like getting 10,000 Likes on a cute photo), but they do not translate to real-world results. Likes do not fund clean water wells.Actionable Metrics
are numbers that directly connect to your project's goals (like Link Clicks, Telegram Joins, or NFT Mints). Always optimize your strategy for action, not just applause. -
Students mustMark as done
Aligning Goals and Metrics: The Analytics Funnel
You do not need to track everything. Think of your audience's journey as a funnel:
- Top of Funnel - Awareness (Discovery): Goal is to let the world know you exist.
- Track: Reach (unique people who saw your content) and Impressions (total times displayed).
- Middle of the Funnel - Consideration (Trust Building): The goal is to get people to care.
- Track: Engagement Rate, and "Super Likes" like Saves and Shares.
- Bottom of Funnel - Action (Conversion): The goal is to get people to donate or mint.
- Track: CTR (Click-Through Rate) and Conversion Rate (how many actually completed the final action).
Keep this simple reference matrix handy. Whenever you launch a post or campaign, ask yourself what your goal is, and then only look at the matching metrics!
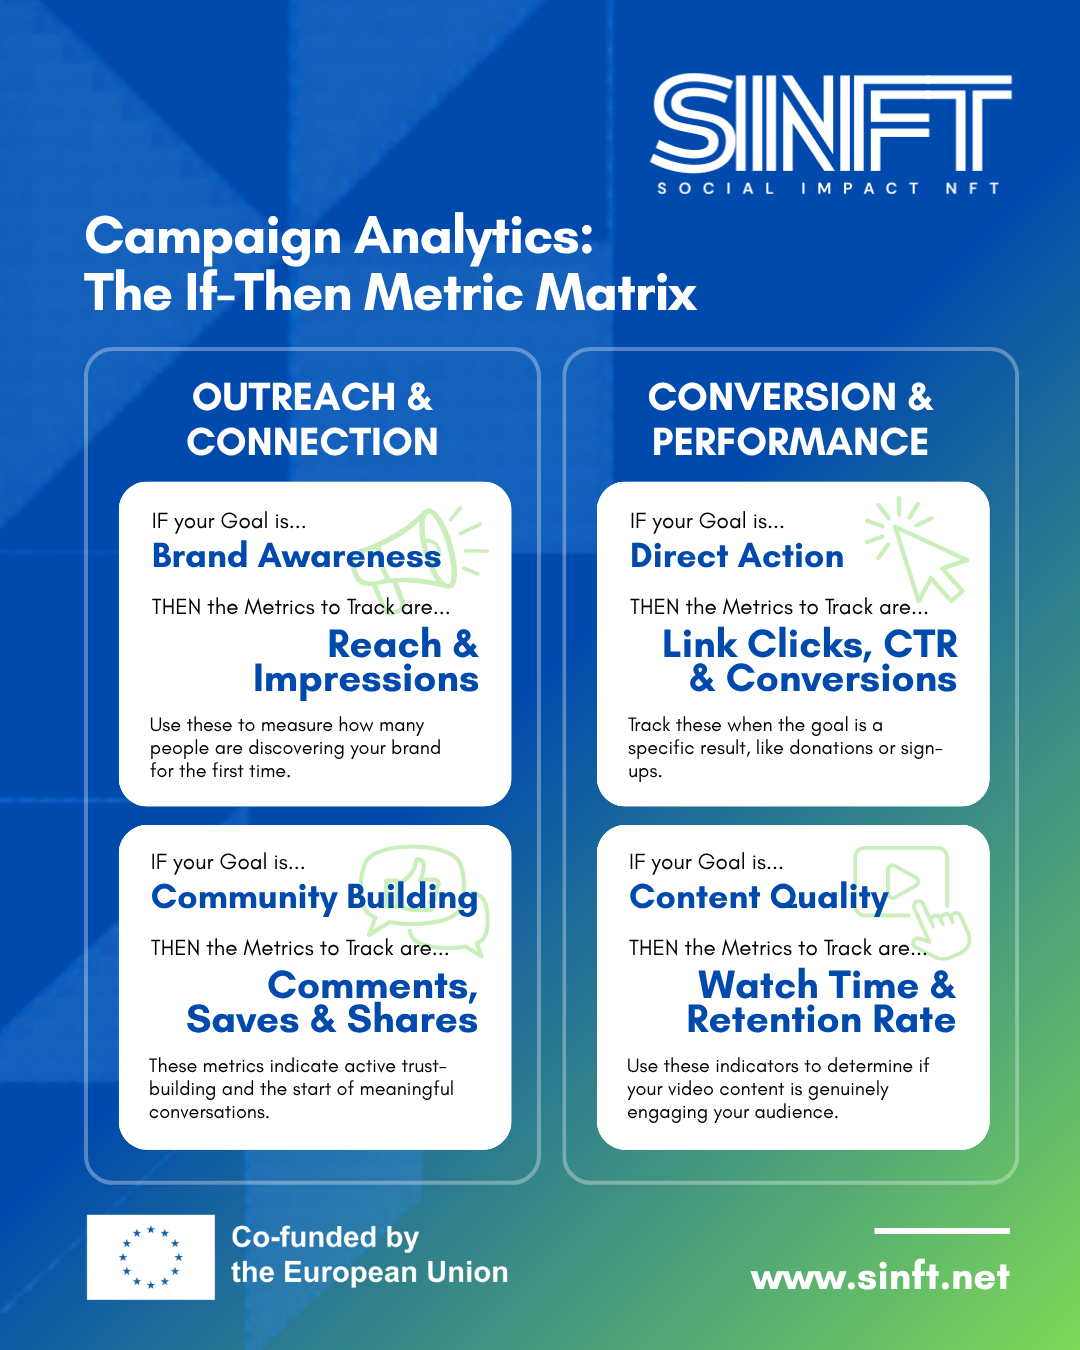
- Top of Funnel - Awareness (Discovery): Goal is to let the world know you exist.
-
Students mustMark as done
Tools Overview: Where to Find Your Data
You do not need expensive, enterprise-level software or a degree in data science to understand your audience. The best tools are completely free. However, looking at raw data without context is just noise.
To build a successful strategy, you need to look at your data through three different lenses: Macro (what the world cares about), Meso (how the public reacts to your brand), and Micro (how your core community behaves).
We have prepared a comprehensive visual guide to help you navigate these three layers. Review the presentation below to see exactly where to click and what graphs to analyze.
The Three Core Analytical Lenses
As highlighted in the visual guide, mastering these three tools gives you a complete picture of your digital impact:
-
Google Trends (The Macro Lens): This is your "Before You Post" tool. It doesn't track your content; it tracks the world's curiosity. You use this to see if people are actually searching for your topic right now, and to compare keywords to ensure you are using the exact language your audience uses.
-
Meta Business Suite (The Meso Lens): This is your main control center for Facebook and Instagram. Here, you discover who is actually engaging with your brand (Age, Gender, Geography) and which specific formats (Reels, Carousels, Stories) are successfully driving "Link Clicks" to your website or mint page.
-
Telegram Statistics (The Micro Lens): This measures the heartbeat of your most loyal supporters. By looking at "Views by Hour" and "Private Shares" in your Telegram channel, you learn exactly when your core community is awake, active, and willing to advocate for your cause behind closed doors.
A Note on Native Platforms: While we focused on these three foundational tools, remember that almost every modern platform has its own built-in analytics. Whether you are posting short videos on TikTok, building a Web3 server on Discord, or uploading documentaries to YouTube, you can always find an "Insights" or "Analytics" button near your profile. The metrics (Retention Rate, Clicks, Demographics) follow the exact same logic we discussed above.
🚨 What If the Statistics Are "Bad"?
Do not panic. A "bad" number is a highly valuable diagnostic tool. It is the audience quietly telling you something is broken. Did you post at 2:00 AM? Was the topic irrelevant to Google Trends? Was the video too long? Embrace the "Failing Forward" mindset. A failed post is just an experiment that taught you what not to do. -
-
Students mustMark as done
Evaluating What Content Works Best: The Iterative Process
Analytics are useless if you don't change your behavior based on the results. Use this 4-step framework:
- Identify the Outliers: Find your Top 3 posts (highest engagement) and Bottom 3 posts at the end of the month.
- Analyze and Ask "Why?": Did the Top 3 have human faces? Were the Bottom 3 full of corporate jargon?
- Form a Hypothesis: e.g., "Our audience ignores graphic posters, but engages with real photos of volunteers."
- Test & Implement (A/B Test): Launch two similar posts next week (A: poster, B: photo). If the photo gets 5x more clicks, your hypothesis is proven. Adjust your strategy!
Example: A mental health charity noticed their long, academic articles were getting 0 shares and very few website clicks. They looked at their data and saw that a quick, 3-slide infographic they posted months ago had 500 shares. They evaluated the data, stopped writing long articles, and switched entirely to educational infographics. Their organic reach grew by 400% in two months, and their volunteer sign-ups doubled because the content was finally easy to consume.
-
Guide & Glossary: The Analytics Dictionary
Whenever you get confused by an analytics dashboard or marketing jargon, refer back to this simple dictionary.
If you learn something new about the topic, feel free to add it and share it with others in this glossary!
-
Ready to test your knowledge?
Take this quick 5-question quiz to review the key concepts covered in this lesson. This brief knowledge check will help you reinforce what you've learned and ensure you're ready to apply these new strategies to your own project.
-
-
-
Lesson 3: Reporting Impact — Telling the Story with Data
-
Students mustMark as done
Why is Reporting Impact Important?
In traditional philanthropy, donors write a check and hope for the best. In the Web3 space, the rules have changed. Trust is your most valuable currency, and the community expects real-time, verifiable proof.
Transparency (Destroying FUD)
The Web3 space has seen scams, making audiences naturally skeptical. Showing exactly where the money went destroys FUD (Fear, Uncertainty, Doubt).-
Mini-Case Study: Giveth.io uses a "Traceability" feature where donors can literally trace their crypto from their wallet to the project's wallet.
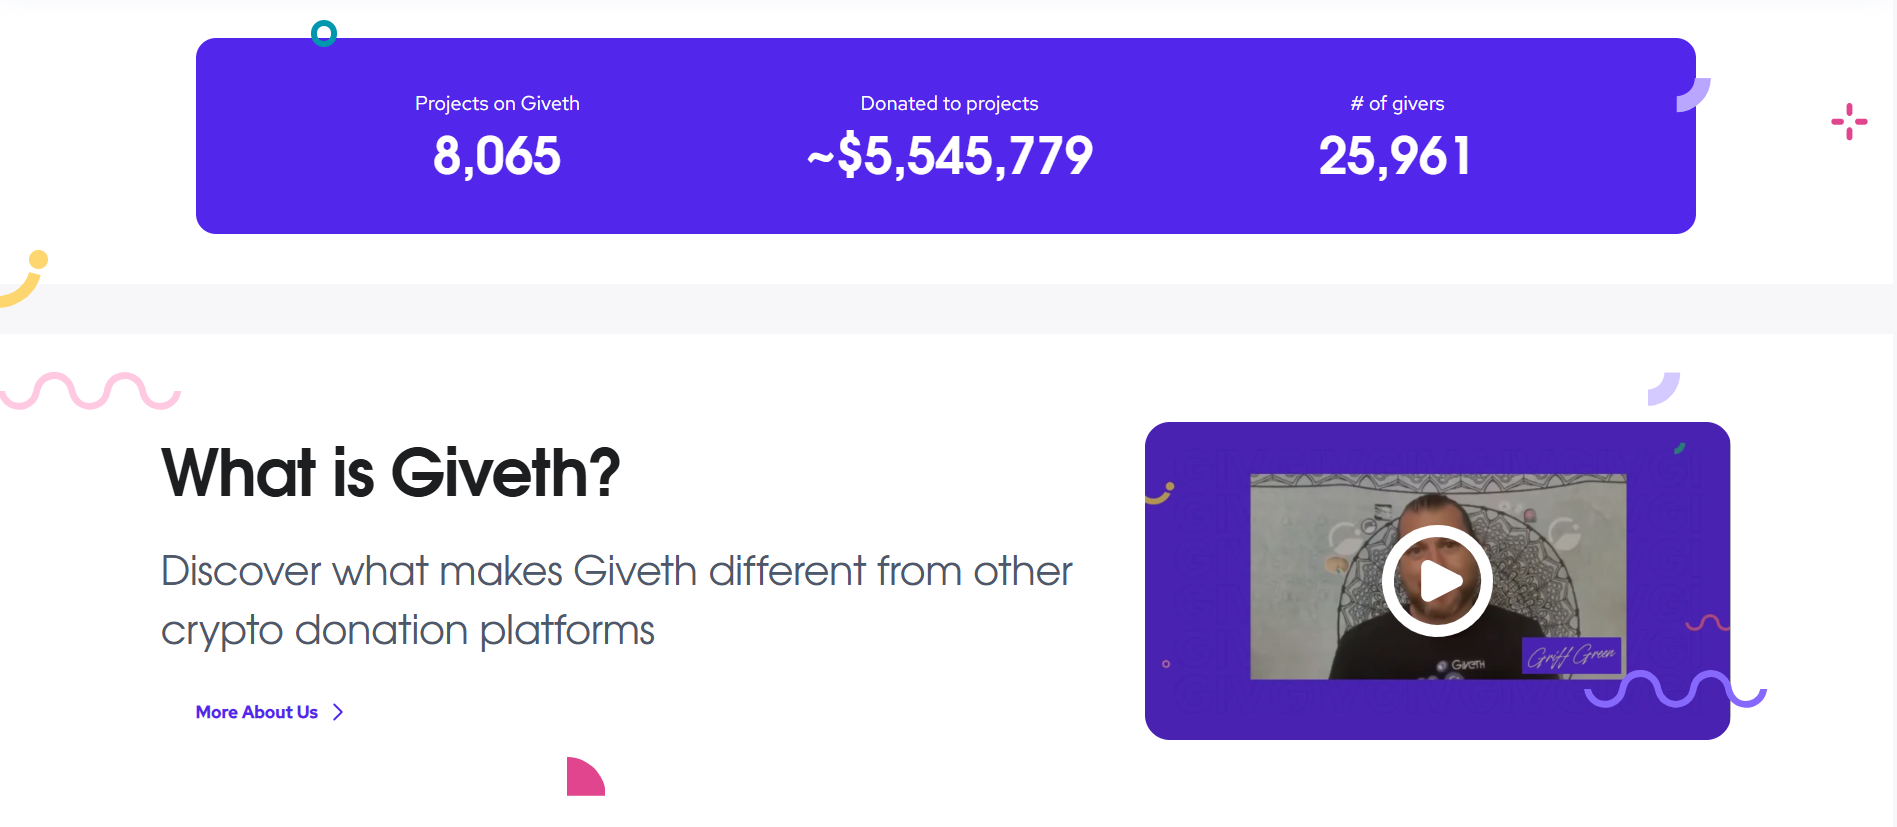
👆 Click the picture to visit the site
Credibility (Attracting Bigger Partners)
To secure major Web3 grants or partner with legacy charities, an impact report serves as your portfolio of execution.
-
-
Mini-Case Study: Endaoment.org (the first on-chain 501(c)(3)) publishes visually stunning, data-heavy reports, allowing them to partner with skeptical legacy charities like the American Red Cross.
-
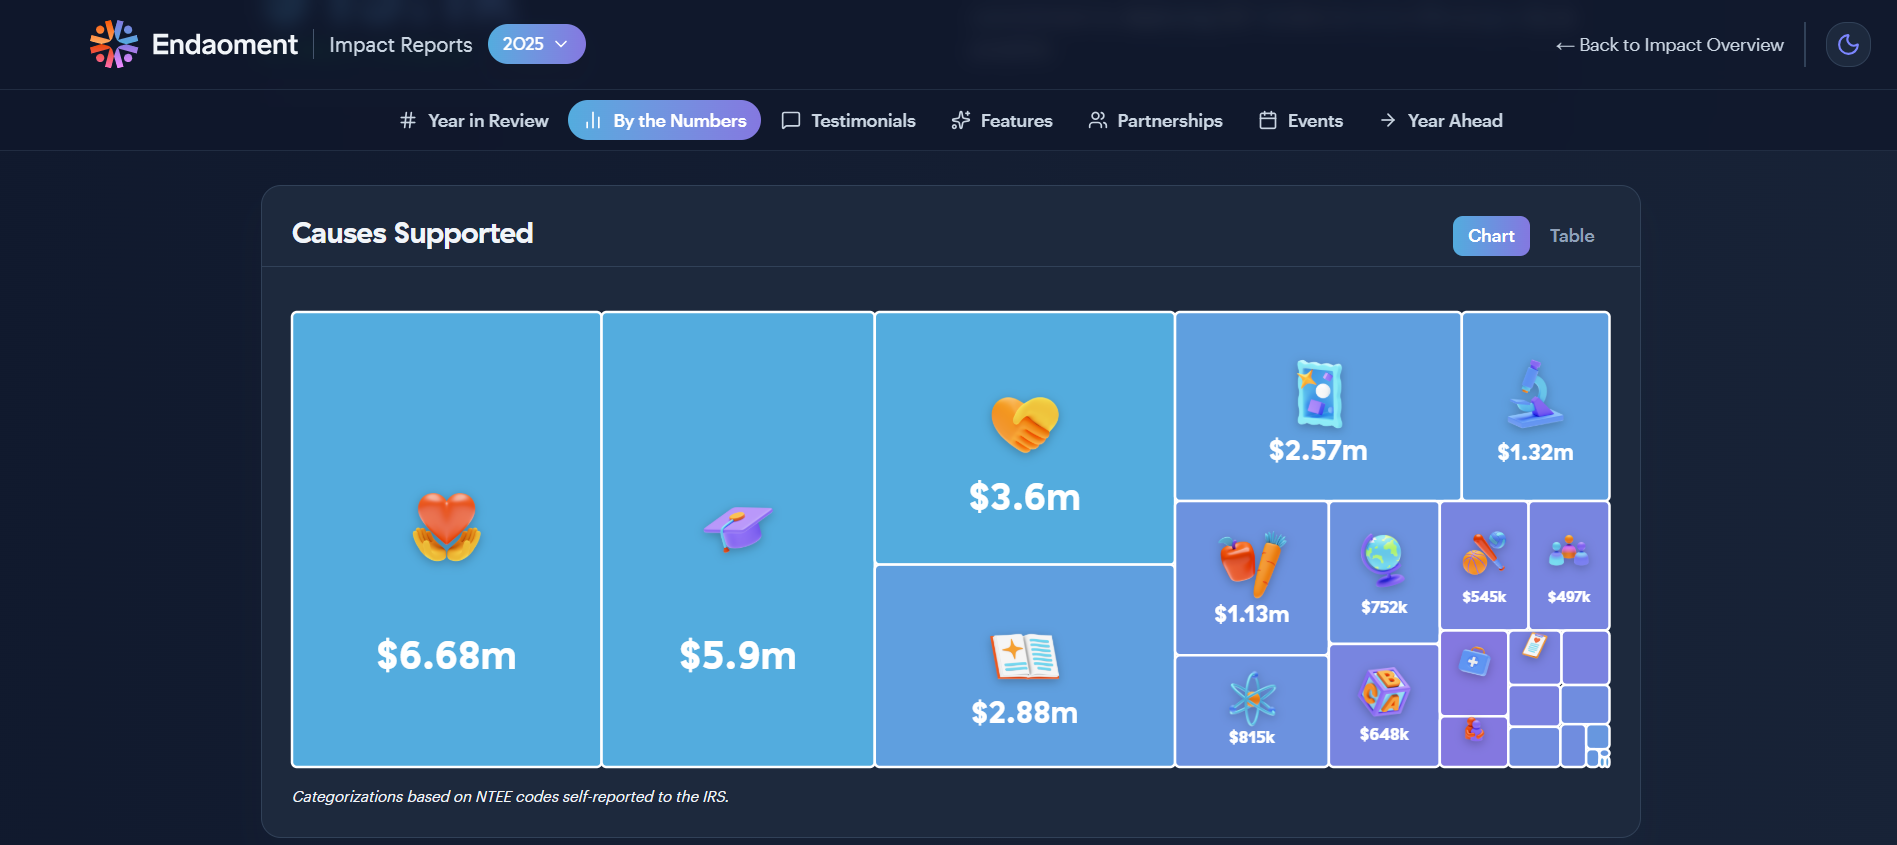
👆 Click the picture to visit the site
The Loop of Engagement (Motivating Supporters)
When a community member sees that their specific NFT purchase planted 500 trees, they feel like heroes.
-
-
Mini-Case Study: World of Women (WoW) continuously reported how NFT sales funded women's charities, turning casual flippers into long-term brand advocates.
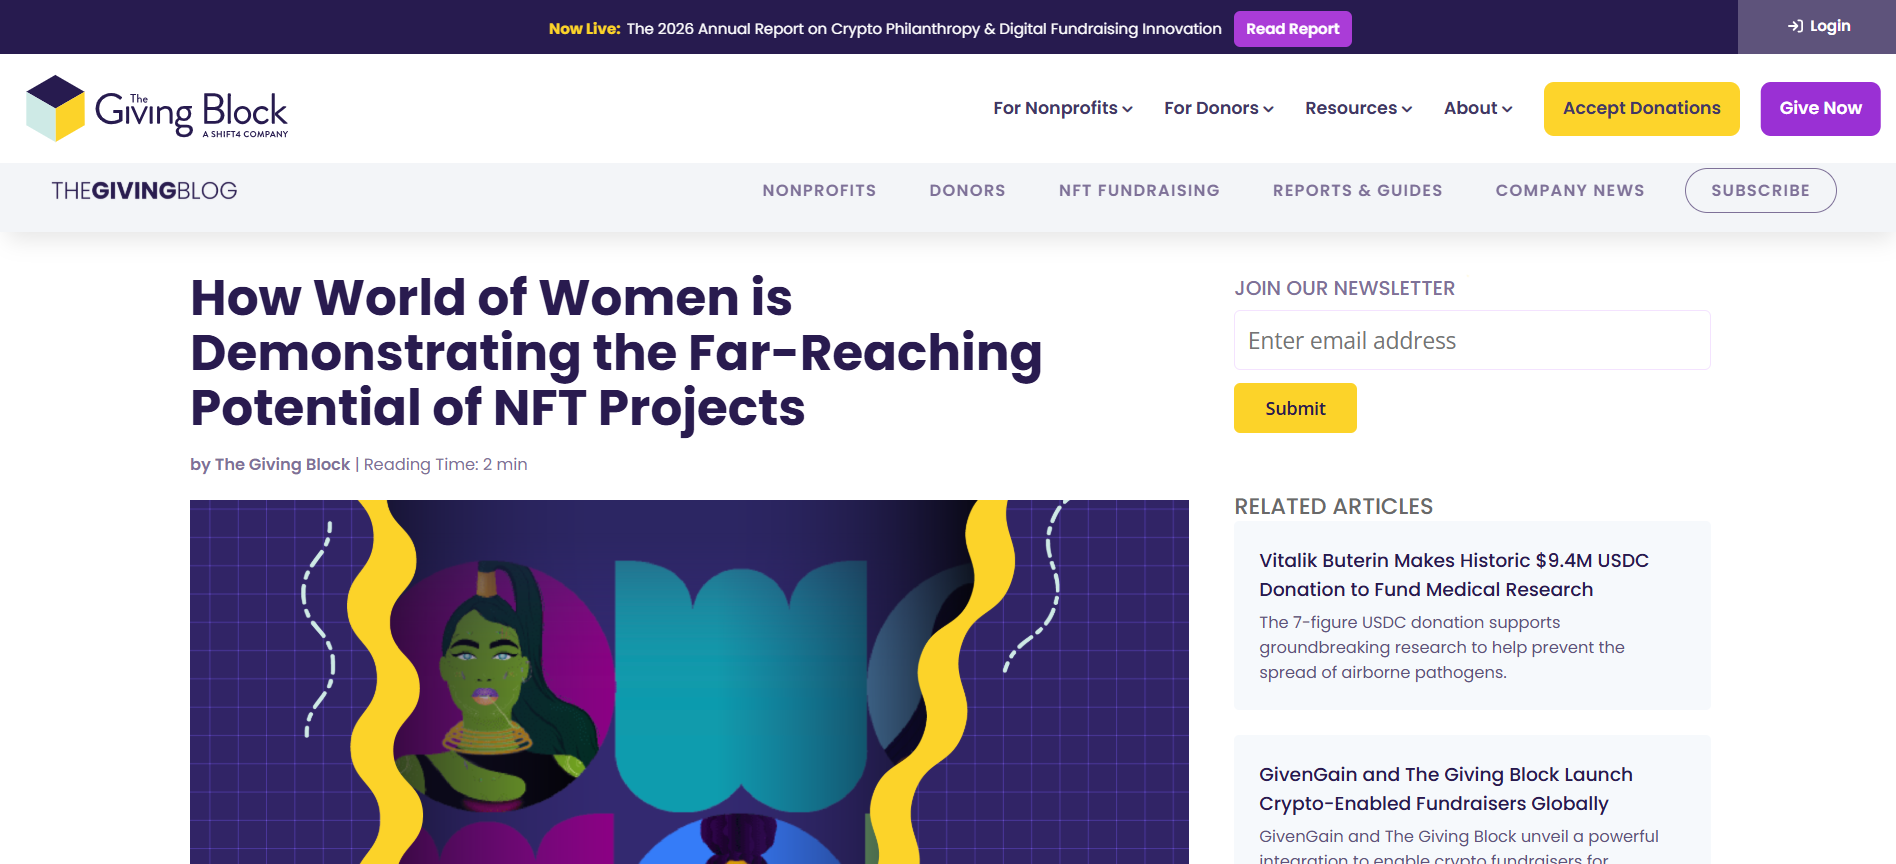
-
👆 Click the picture to visit the site
🚨 The Cost of Silence
What happens if you don't report? In the fast-paced digital world, silence is often interpreted as a "Rug Pull" (a scam). Even if your team is working incredibly hard behind the scenes, if you do not report that progress visually to your community, they will assume you took the funds and abandoned the project. Always over-communicate your impact. -
-
Students mustMark as done
Understanding Impact Reports
A modern impact report is not a boring 50-page PDF. It is a visual storytelling tool. It usually takes one of four forms:
-
The One-Page Infographic (X/Discord announcements).
-
The Social Carousel (Instagram/LinkedIn breakdowns).
-
The Dynamic Dashboard (Notion/Dune Analytics for live Web3 data).
-
The Mini-Documentary (TikTok/YouTube Shorts).
The 5 Categories of Impact
Blend these five categories to tell a complete story:
-
Financial (Inputs): Resources gathered ("15 ETH Raised").
-
Operational (Outputs): What was created ("20 Laptops Delivered").
-
Human (Outcomes): How lives changed ("School attendance rose 40%").
-
Community (Engagement): Supporter involvement ("50 active volunteers").
-
Web3/On-Chain (Verifiability): Blockchain proof ("1,200 Unique Wallets").
The "Hero Metric":
Never overwhelm your audience with 20 different statistics on one page. Choose ONE "Hero Metric" — the single most impressive and understandable number of your campaign — and make it the star of your report.Real-World Masterclasses in Impact Reporting
To understand what a great impact report looks like, we need to study the best projects. Click through these real, working examples to see how top-tier organizations blend Web3 tech, traditional philanthropy, and beautiful data visualization.
Case Study 1: Gitcoin (The Web3 Standard)
 👆 Click the picture to visit the site - Gitcoin Impact Portal
Gitcoin is the gold standard for funding public goods in Web3. Their impact page doesn't just say "we do good." It uses massive, live Hero Metrics right at the top (e.g., "$60M+ Total Funding Distributed," "3.8M+ Total Donations").
The Lesson: They use clean, interactive dashboards. They don't hide the numbers; they make the data the art. If you are building a Web3 project, this is the level of transparency your community expects.
Case Study 2: Plastiks (Verifiable Physical Impact)
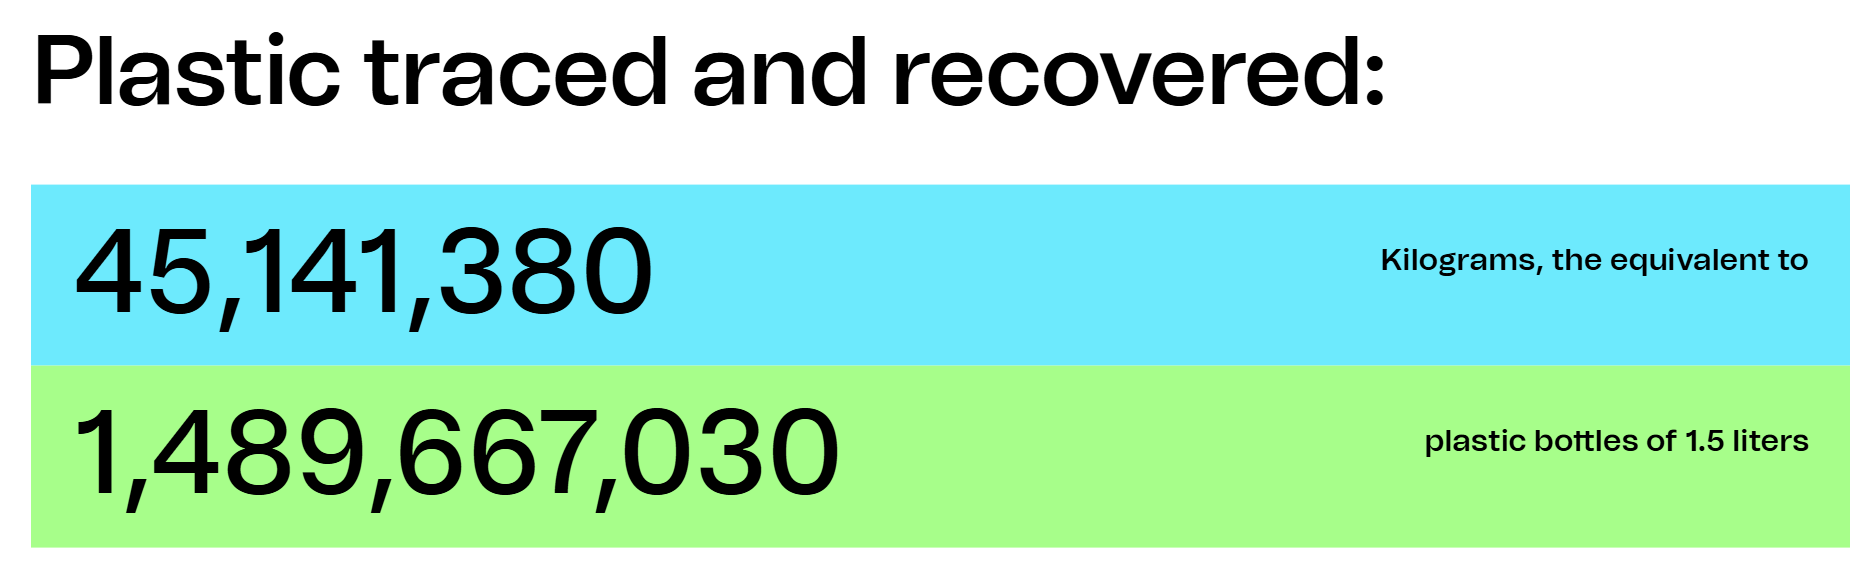
👆 Click the picture to visit the site - Plastiks.io
Plastiks bridges Web3 and environmental cleanup. Instead of vague promises, their platform uses NFT utility to track physical plastic recovery. Their dashboards show exactly how many kilograms of plastic have been collected, verified, and recycled globally.
The Lesson: Tie your digital asset to a physical, measurable unit (e.g., 1 NFT = 10 kg of plastic recovered). By building a live dashboard around a single "Hero Metric," you prove that your digital tokens have a tangible, real-world footprint.
Case Study 3: charity: water (Proof through Technology)
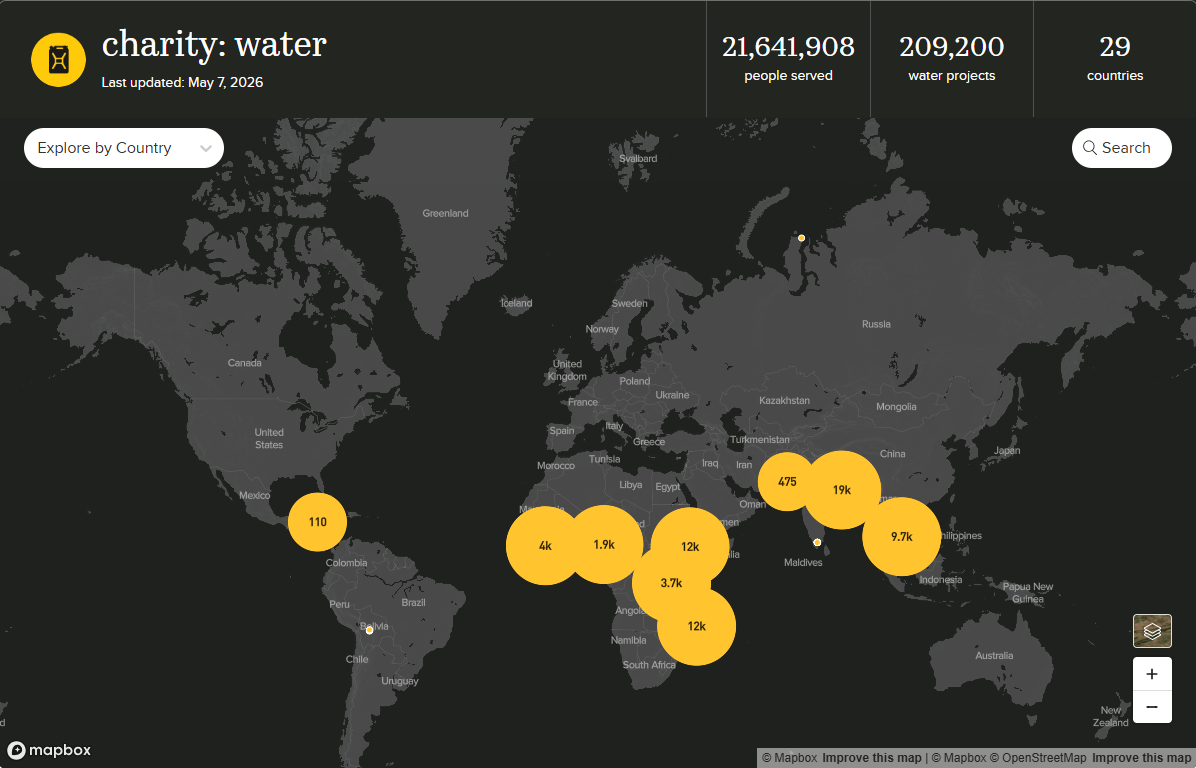
👆 Click the picture to visit the site - charity: water
They pioneered the 100% transparency model in modern philanthropy. They don't just say they build wells; they use GPS coordinates, remote sensors, and mapping technology to provide undeniable visual proof of every single completed water project around the globe.
The Lesson: If your social impact is tied to a physical location (planting trees, building shelters, delivering supplies), map it. Abstract numbers become intensely real and trustworthy when supporters can see the exact location on Google Earth and view photos of the specific community they helped.
-
-
Students mustMark as done
Presenting the Data Clearly: The 3 Visual Strategies
Data is entirely useless if it is confusing. In the era of social media, you have exactly 5 seconds to capture your audience's attention before they swipe away.
To stop the scroll and build radical trust, you must move from merely "reporting" data to "translating" it. Your donors and holders do not want to read an Excel spreadsheet on Instagram; they want to see a story.
We have analyzed the best impact campaigns across Web3 and traditional philanthropy to extract their design secrets. Before we break them down textually, we have prepared a visual masterclass.
👇 Click through the presentation below to see real-world examples of how to design an impact report that builds trust and drives action.
Decoding the Presentation: The 3 Core Strategies
-
The "Wrapped" Aesthetic (Personalized UX): Shift focus from "what we did" to "what YOU unlocked." Frame operational outputs as human wins.
-
The B2B Logo Power-Play & Gamification: Blend established legacy logos with Web3 digital assets to bridge physical impact and digital space. Add progress bars to carousels to prevent drop-off.
-
The "Agency" Narrative (Raw Humanity): State clearly: "They did it themselves." Highlight the agency of the recipients. Reject polished stock photos for raw, authentic documentary footage.
Explore the Campaign References
To see exactly how these strategies look in the wild, click through the original Instagram campaigns we analyzed in the presentation:
🔗The "Wrapped" Aesthetic: charity: water "2025 Wrapped" Campaign
🔗The B2B Collage & Gamification: Plastiks "2024 Recap" Campaign
🔗The Cohesive Series: Pencils of Promise "Season of Promise" Campaign
🔗The "Agency" Documentary Video: GiveDirectly "Malawi Cash Transfer" Campaign -
-
Students mustMark as done
Sharing the Report: The "Hub and Spoke" Distribution Strategy
Creating the report is 20% of the work. Distribution is 80%.
-
The Hub (Permanent Archive): A dedicated webpage or Notion workspace containing the full report, financial breakdowns, and hyperlinks to Etherscan smart contracts for on-chain verification.
-
The Spokes (Micro-Content):
-
Instagram/LinkedIn: 5-slide visual carousel.
-
X (Twitter): A data-heavy "Mega-Thread".
-
TikTok/Reels: A raw, short-form video from the founder.
-
Owned Channels: Send a personalized email newsletter and host a Live Voice AMA in Telegram/Discord for your core community first.
-
The Amplification Loop: Empowering Your Holders
The ultimate goal of an impact report is to make your community feel like heroes. When they feel proud, they will share it for you.
-
Provide your Telegram/Discord members with a "Click-to-Tweet" link so they can instantly share the Hero Metric on their own profiles.
-
Give them custom digital badges or graphics that say "I funded this" to post on their Instagram stories. Turn your community into a decentralized marketing team!
The 5-Day "Content Waterfall" Launch Schedule
Do not release all your content on the same day! Treat your Impact Report like a major product launch to keep your project trending for a whole week.
📅Day 1 (The Inner Circle): Drop the report exclusively in your Telegram/Discord chat and send the Email Newsletter. Make your holders feel special.
📅Day 2 (The Visual Drop): Publish the 5-Slide Carousel on Instagram and LinkedIn.
📅Day 3 (The Deep Dive): Publish the analytical Mega-Thread on X (Twitter).
📅Day 4 (The Human Face): Post the short-form raw video on TikTok/Reels explaining the biggest "Win" from the report.
📅Day 5 (The Live Celebration): Host a live Voice AMA in your Discord/Telegram to answer questions, celebrate the metrics, and discuss the roadmap for the next campaign. -
-
Ready to test your knowledge?
Take this quick 5-question quiz to review the key concepts covered in this lesson. This brief knowledge check will help you reinforce what you've learned and ensure you're ready to apply these new strategies to your own project.
-
-

Shape the Future.
Mint the Change.